The Darkened Continent
Abstract
Background
In the course of that analysis I realized that the regions most affected by energy-driven reductions in GDP would also be those with the highest population growth rates. One region that seemed at particular risk was Africa. That finding, along with recent reports that Africa will be threatened with food insecurity over the same period because of climate change and HIV/AIDS has prompted me to take this closer look at their situation.
The analysis is conducted though a numerical model that uses the parameters discussed below. The model is contained in a Microsoft Excel ® spreadsheet, which is available on-line. The model may be downloaded and the parameters altered to explore their effects on the outcome.
Introduction
This paper is my attempt to connect those dots, to tease some order out of the chaos of the news reports. Because this is a quantitative analysis, much of the information is presented numerically and in graphs. This is a deliberate decision. It's very difficult to tell a tale this big with individual anecdotes, as compelling as they may be. While personal stories can bring a situation to life, they cannot effectively convey the scope and scale of something as large as this. Each graph has a crucial tale to tell. I hope you spend some time with each one, thinking about what those bloodless numbers mean in terms of human lives.
Parameters and Assumptions
Energy Supply
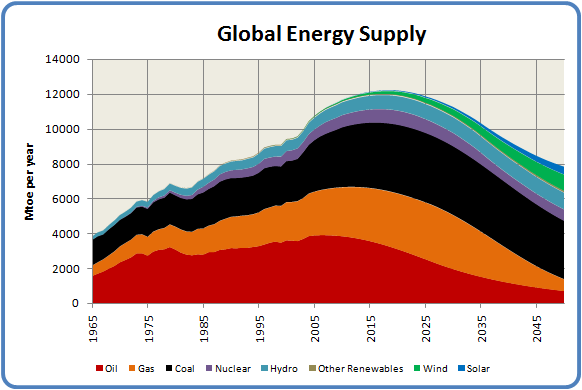
Overall, Africa has few other domestic energy supplies (coal, hydro or nuclear) with which to offset the decline of oil and natural gas. The loss of energy supplies will affect all aspects of African life, from transportation and industrial activity to the stability of their electrical supplies. Many African countries already have severe energy problems from oil and gas shortages, as well as unstable, under-supplied electrical grids.
Energy Intensity
In
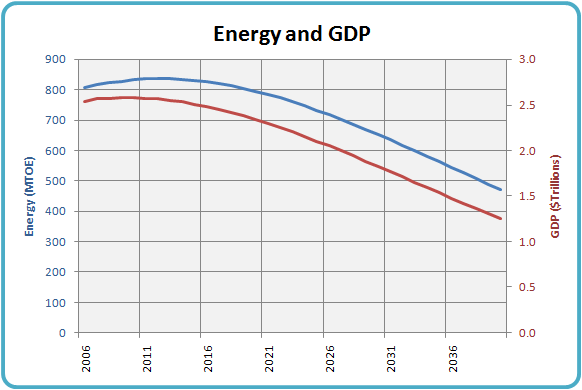
my analysis I use energy consumption as a proxy for economic
activity, allowing me to make estimates of changes
in economic performance over time.
Energy intensity is the measure of the amount of energy it takes to produce a dollar's worth of economic output. This value varies widely between countries, depending on their level of industrialization, the mix of services and manufacturing in their economies, and the attention they pay to energy efficiency.
The
American Energy Information
Administration maintains extensive data on national energy
intensity, all of which is summarized in this
spreadsheet. I used this data as the basis for
my intensity projections. I use a projection of African
countries' energy
intensities to predict how energy changes
will influence the continent's overall economic performance in the next
four decades.
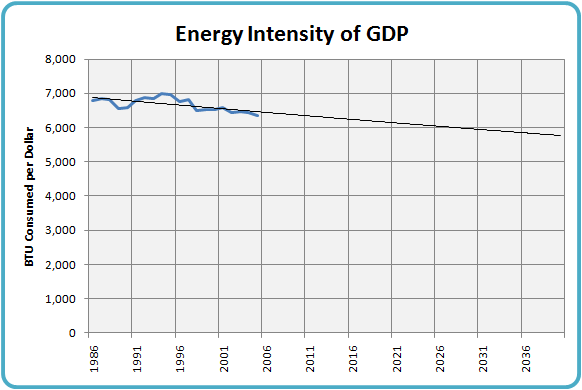
In the case of Africa, a linear projection of the historical data indicates an ongoing improvement in energy intensity of about 0.5% per year. As you can see, the trend is not terribly stable, and it could easily be less than that. Nevertheless, that is the value used in the model.
GDP
Population Growth
Climate Change
This estimate has been incorporated in the model as a consistent 1% per year decline in agricultural output due to climate change.
Oil Prices
The model assumes that oil prices will rise proportionally to the depletion of global supplies at the rates described in the World Energy model. From Africa's perspective this is an extremely optimistic estimate. Given the price increases the world has already experienced, a drop of half in the global oil supply would certainly cause more than a doubling of the price.
The increasing cost of oil appears in two places in the model. The first is in the cost of domestic food production, where oil is assumed to represent 15% of the total input costs of agriculture. The second place is in the distribution of food imports. Because almost all such transportation in Africa is by road, oil price increases will directly affect food distribution costs.
Fertilizer Prices
For the purposes of this model I have taken the average US fertilizer price over the last 25 years, and projected the trend out to 2040. This procedure indicates a rise of almost 500% over that time, which may be conservative given recent trends.
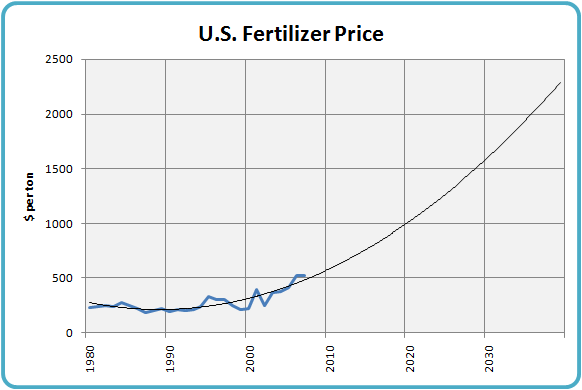
There are two significant facts about fertilizer use in Africa. One is that fertilizer in Africa costs two to four times the world price, largely due to the cost of transporting it inland by road from port cities. The second fact that follows from this is that African farmers use only one tenth of the world average fertilizer per hectare.
The model incorporates fertilizer prices in two ways. One is by projecting a decline in crop yields of 0.5% per year due to declining fertilizer use. The other is by projecting an increase in the domestic cost of food production -- the price increases of the above graph are incorporated into the cost of food production, assuming that fertilizer comprises 10% of the input costs of African agriculture.
HIV/AIDS
In a speech in 2004, the Executive Secretary of the UN Economic Commission for Africa stated that AIDS is causing a decline in GDP of 0.4 to 1.5% per year. As a result, the model incorporates a 1.0% annual decline in GDP due to AIDS.
In the same speech the Executive Secretary also said that AIDS has "a tremendous negative impact on agricultural productivity". The model assigns a further 1% per year decline to agricultural output to account for this effect.
Agricultural Productivity Increases
The model incorporates the effect of such improvements by applying a long-term 1.0% per year increase in yields after the negative pressures have been incorporated.
The Current Food Supply
The extent of this calorie shortfall and the low probability of growth in domestic production mean that every new mouth in Africa must be fed with imported food. As the population grows and domestic food production shrinks the dependence on imports, either as purchases or foreign aid, will increase rapidly.
The model assumes a constant gross calorie requirement of 3100 calories per day per person, about what is consumed today. This number represents the total number of calories before processing losses or wastage. Once those are taken into account this should represent an actual food value of around 2600 calories per day.
Cost of Imported Food
This estimate is also likely to be low, as the FAO also estimated that the total cost of food imports by Low Income Food Deficit Countries (a group that extends beyond Africa) was in the neigbourhood of $85 billion in 2006, and is projected to rise by 25% to $107 billion in 2007.
Cost of Domestic Food Production
References that support this assumption come from the International Monetary Fund, "in Sierra Leone, ... the price of a bag of local rice—the national staple food—was about 320 leones ($26-$32) in 1995, while imported, subsidized rice was priced at 280 leones ($23-$28)", as well as from a 2002 study by the National Labour and Economic Development Institute (NALEDI) based in South Africa that states, "The domestic price of maize (i.e., the South African Future Exchange (SAFEX) spot price) is currently trading well above the import parity price", and "The 2000/2001 marketing year was a large harvest for white maize (6.4 million tons) with producer prices being close to export parity prices."
The approach of assuming present-day parity between domestic food production costs and import prices ignores the intricacies of tariffs, subsidies, international exchange rates, various forms of arbitrage and the different costs of agricultural inputs in various regions of the world. However, given the commoditization and globalization of the world food market, it seems like a broadly realistic assumption.
Cost of Distributing Food Imports
In the model, distribution costs rise in direct proportion to the decline in the oil supply. As previously mentioned, this factor is probably too optimistic -- transportation costs are likely to soar as the world's oil supply depletes.
Inflation of Food Imports
Annual inflation reports range from over 100% for wheat to an FAO projection of 30% to 40% for oils and coarse grains. The recent massive inflation in wheat prices is especially worrying, as wheat comprises almost 40% of Africa's total calorie imports. In light of these predictions, the model uses a relatively conservative long-term inflation factor for imported foods of 12% per year.
Water
Whatever the reasons, the shortage of irrigation water along with the unavailability of fertilizer described above, represent major obstacles to the introduction of high yield "Green Revolution" crop varieties to Africa.
Foreign Aid and
Development Assistance
In the same speech the Director-General also said, "The World Bank, the major funding source for Africa, targeted 39 percent of its lending in 1978 to the agricultural sector in Africa. By 2002, this proportion had dropped to 6 percent."
This evidence implies that the world's money and power brokers have, without any fanfare or public announcement, given up on Africa. They have apparently decided that Africa cannot be salvaged by aid or investment, and they appear to be in the process of cutting the lifelines. There are some cold, calculated decisions being made in comfortable boardrooms around the world.
Although some of these deficiencies may be rectified over the coming decade, it seems utterly unrealistic to hope that foreign aid and investment will rise to the levels required to deal with a further expansion of Africa's food shortage. In addition, the global economic crisis that is now underway may severely restrict the future availability of funds for both food aid and development loans.
Now that you have an understanding of the factors used in the analysis and how I think they fit into the picture, let's run the model and see what it tells us.
The Results
The upper red area indicates the amount of imported food that will be required to give each member of Africa's growing population an average gross allotment of 3100 kilocalories per day.
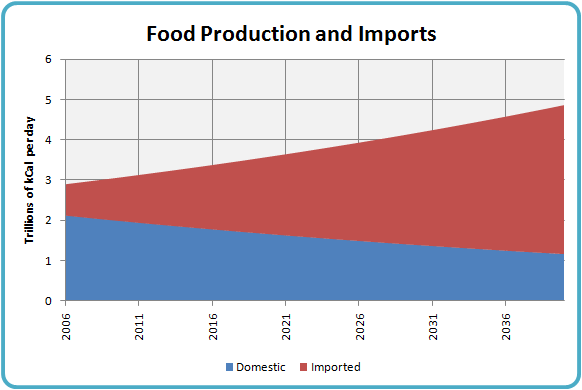
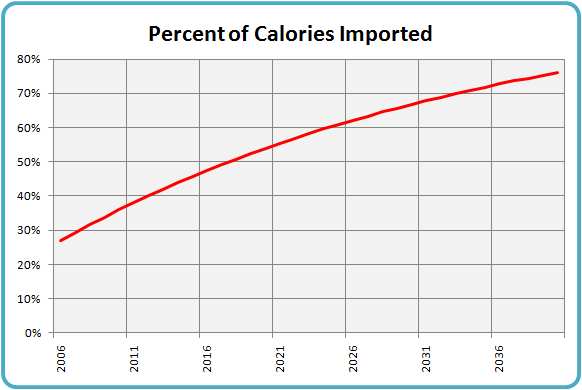
From the above graph we can see that the proportion
of imported food rises rapidly over time, due to the rising population
and falling domestic productivity. The changing proportion is
directly illustrated in the next graph.
First, the required amount of food may simply not be available on the world market, especially if climate change continues to disrupt world grain harvests. This will lead to increasing shortages in many food importing countries.
Second, the world food supply may be further constrained by biofuel production if international agreements are not reached to limit its production from food sources. That constraint will further heighten Africa's food insecurity.
Third, African countries will become more and more vulnerable to the use of food as a weapon in both international and internal conflicts
Fourth and most important, the global cost of food is already rising steeply and is showing no signs of abating. Price inflation for imported food will add to the effects of growing population, reduced domestic yields and a shrinking world food market, and will rapidly make a difficult situation intolerable.
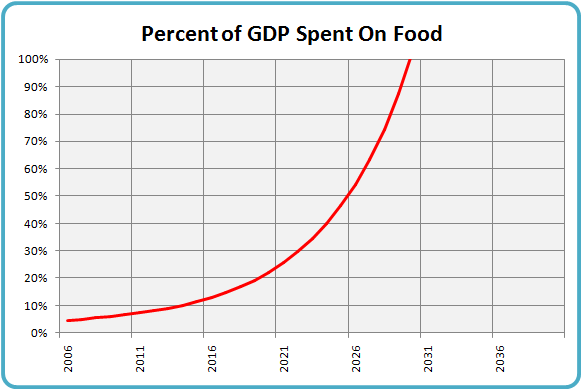
Today, the continent spends about 5% of its total GDP on food, both for domestic production and to pay for food imports. Under the assumptions of this model the proportion of the continent's GDP spent on food will rise to 10% in the next eight years, to 20% by 2020 and to 50% by 2026. If this trend were to continue unabated, spending on food would consume all the continent's money by 2030.
This end result is, of course, impossible. No family, country or continent can spend all its money on food, because there are other essential needs like water and shelter that must also be met. In addition, the economy needs other activity to generate the money to buy imported food. That implies that a certain amount of economic activity must be maintained to generate a stream of revenue.
Obviously something will happen between now and 2030 to interrupt the smooth acceleration of that last graph.
Where Will the Money Come From?
Looking at a variety of African nations already experiencing some degree of dissolution, I would estimate that the breaking point comes somewhere between 25% and 40% of their GDP. An examination of the curve in the previous graph shows that point could arrive for the entire continent sometime around 2025.
The most likely thing that will interrupt this trajectory is that African governments will simply not invest the required amount of money in the purchase of imported food. They will not do this because of reluctance or ulterior motives; they will do it because they don't have the money.
Most of the value in an economy is in fact tied up in capital, essential operating expenses or household income. Much of the capital, like machinery or real estate, is needed to keep the economy running and can't be liquidated without causing negative impacts on other activities. This would apply, for example, to electrical power or transportation infrastructure. Operating expenses, especially in most of Africa, are shaved to the bone. In most African economies there is little or no surplus.
If an African government wants to find money to buy food, it has to come from money that has already been allocated to other purposes. Where is it to be taken from? Are medical, police, fire or school services less important than food? Would it be possible to get the money by raising taxes, when individual budgets are already at the breaking point? Finding a few percent of a country's GDP that can be re-allocated without social risk or political penalty is a Herculean task. Finding the same amount again plus a little more in the following year, and again the year after that, and then the one after that, is inconceivable.
With little foreign development money available and their own economies shrinking, African governments will do the best they can. They will find some money to feed their people, but it will not be enough in most cases. Here is what a possible spending scenario would look like, compared to the requirements given in the previous graph.

This result may delay society's final breaking point for a decade or more, as the 40% crisis point moves out to 2040 instead of arriving in 2025. The tragic consequence, however, is that food requirements from now on will be continuously and increasingly underfunded. This will result in ever-increasing amounts of malnutrition, and eventually outright starvation.
A Population Scenario
I left all the values from the original model untouched, except that I changed the percentage of GDP used to produce and import food to follow the "Possible" curve above, instead of simply tracking the population growth. That gave me the amount that would be spent on food in any given year. I then assumed that the amount needed to produce domestic food would all be spent -- after all, growing food is always cheaper than buying it. The money left over would be used to buy and distribute more expensive imported food.
The limited amount of money available would result in less food being purchased than was actually needed. That "calorie gap" is what creates under-nutrition and famine:
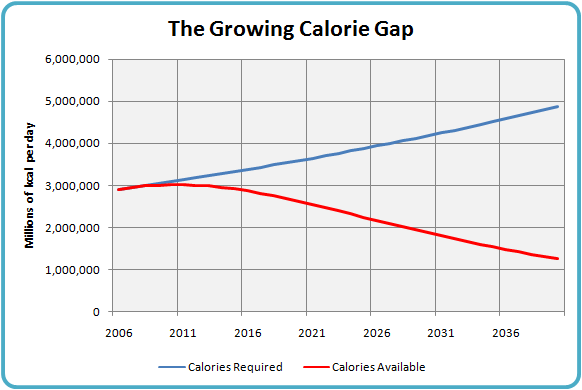
I then performed a grisly bit of arithmetic. For each year I divided the total calorie shortfall by the amount required to sustain a person. The answer becomes the number of people who can't be supplied with food, and as a result cannot survive.
That unhappy number was then subtracted from that year's population, with the remainder left to grow at the UN-projected rate of 1.535%. The result of this unpleasant exercise is the following picture of African population levels:
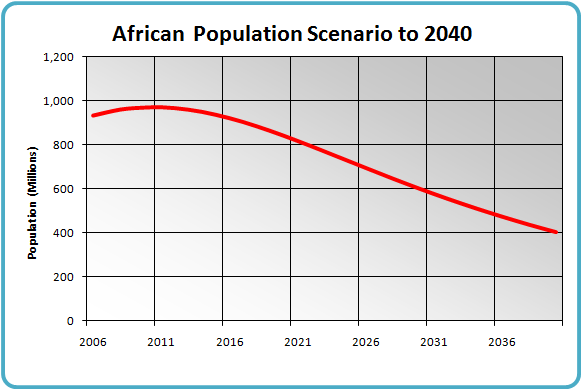
Please understand one very important thing: This is not a prediction. It's something much more nebulous -- it's a scenario based on projections of foreseeable trends. It is 100% certain that the future will not unfold in exactly this way. How different the actual future is, and in what ways, will depend on a wide variety of natural and human influences. It's up to you to decide if I've described the African situation accurately enough for this outcome to be possible.
When you assess that probability though, keep in mind that I have made every effort to err on the side of caution and to keep my assumptions conservative. As a result the scenario could just as easily be too optimistic as too pessimistic.
Social Consequences
As the calories available begin to shrink, there is increased competition for them. For a while that just means rising food prices Once prices cross some threshold of acceptability we begin to see protests and food riots. If the food supply continues to shrink those in power have two choices. If the rule of law is strong and levels of corruption are low they may institute rationing. If the rule of law is weak and official corruption is the norm, those in power will act forcibly to secure the shrinking food supply for themselves. Force replaces law, and those without power are left to fend for themselves however they can. This is now the situation in Zimbabwe.
The accumulation of stresses from social breakdown and food shortage easily escalates to the point of warfare, either civil war as seen in Darfur or outright international war as experienced in the Congo.
When these later stages are reached, the human toll begins to mount rapidly. While the number of deaths from outright starvation currently being experienced in Africa is difficult to estimate, it seems to be rising much faster than a simple mathematical decline in "average calories per person" might suggest. For example, even though hostilities in the Democratic Republic of the Congo have been officially over for three years, more than 40,000 people a month are still dying from malaria and starvation. In fact since 1998, 5.4 million Congolese have died from war, starvation and disease - an "average" rate of 75,000 a month.
Human
Consequences
Infant Mortality
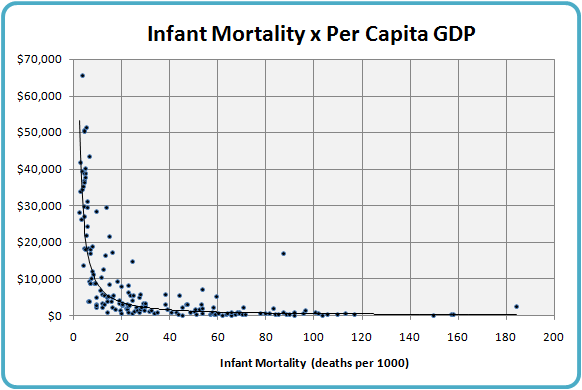
The average infant mortality rate in Africa is currently 91 per 1,000 live births compared to about 5 per 1000 in Europe. The implication of this graph is that as Africa's per capita GDP drops further due to the effects of energy decline, infant mortality rates will rise -- perhaps to double or triple their current levels. While this will have the effect of slowing population growth, the human cost will be enormous.
Life Expectancy
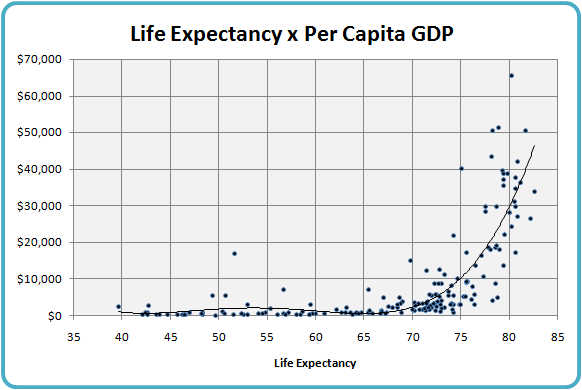
As with infant mortality, life expectancy reductions become more pronounced as incomes drop below $3,000. Across the continent, life expectancy averages between 50 and 55 years, with higher numbers in the more developed north and lower numbers in the AIDS-afflicted south. Life expectancies have been falling in recent years, largely due to the AIDS pandemic. As incomes drop and food shortages add the stress of malnutrition, that decline will continue.